
Protein Concentration A280 Calculator
From an absorbance at 280 nm to mg/mL and molar concentration in one step. This protein concentration A280 calculator predicts the extinction coefficient from a sequence (Trp, Tyr, cystine), uses a known ε or the 1 A = 1 mg/mL approximation, corrects for nucleic-acid contamination with the A260/A280 ratio (Warburg-Christian), handles NanoDrop 1-mm and 0.2-mm paths and dilutions, and converts mg/mL to µM and back.
✓ Trusted by protein biochemists, purification cores & studentsProtein Concentration from A280
c (mg/mL) = A280 × dilution ÷ (ε0.1% × path). Give the absorbance, the path length, any dilution and either the molar extinction coefficient with the molecular weight, the mass extinction coefficient (ε0.1%, i.e. A for 1 mg/mL), or pick a common protein. The protein concentration A280 calculator returns mg/mL and µM.
Extinction Coefficient and MW from the Sequence
ε280 = 5500 × nTrp + 1490 × nTyr + 125 × ncystine (Pace et al., 1995). Paste the one-letter sequence (tags included); the protein concentration A280 calculator counts the chromophores, gives ε for reduced and all-cystine forms, the molecular weight, ε0.1% and warns when the value is unreliable (no Trp).
Correct for Nucleic Acid: A260/A280 and Warburg-Christian
Nucleic acids absorb strongly at 280 nm and inflate protein readings. Enter A260 and A280 (blank-corrected); the protein concentration A280 calculator reports the ratio, the classic Warburg-Christian estimate (1.55 A280 − 0.76 A260 mg/mL), the Kalckar/Layne alternative, the approximate nucleic-acid content, and how much your ε-based value should be trusted.
Dilution Planner, Total Yield and Recovery
Enter the stock concentration you measured, the volume you have, the concentration and volume you need, and (optionally) the starting amount before purification; the protein concentration A280 calculator gives the pipetting volumes, the total mass in hand, the recovery and the number of aliquots.
mg/mL ↔ µM and Gel / Assay Loading
Molar concentration = mg/mL ÷ MW (kDa) × 1000 µM. Convert either way, then find the volume needed to load a given mass on an SDS-PAGE gel or to reach a given molar amount in an assay. The protein concentration A280 calculator also gives molecules per µL for single-molecule and binding work.
🕘 Recent calculations
- No calculations yet — your last 10 results will appear here.
Formulas: c (M) = A280 × DF / (ε × l) · c (mg/mL) = c (M) × MW = A280 × DF / (ε0.1% × l) · ε0.1% (mL mg⁻¹ cm⁻¹) = ε / MW; ε1% = 10 ε0.1% · ε280 = 5500 nTrp + 1490 nTyr + 125 ncystine (Pace 1995; ±5 % with Trp, ±10 % or worse without) · average residue mass 110 Da; sequence MW = Σ residue masses + 18.02 · Warburg-Christian: protein (mg/mL) = 1.55 A280 − 0.76 A260 · Kalckar: 1.45 A280 − 0.74 A260 · A260/A280 ≈ 0.57 pure protein, 1.8 pure DNA, 2.0 pure RNA · µM = mg/mL / kDa × 1000 · molecules/µL = µM × 6.022 × 10⁸ · keep A between 0.1 and 1.0 (NanoDrop auto-paths 1 mm/0.2 mm extend to ~100 mg/mL for ε0.1% 1).
A protein concentration A280 calculator converts the absorbance of a protein solution at 280 nm into milligrams per millilitre and micromolar, using the Beer-Lambert law and an extinction coefficient that comes either from the protein’s sequence (tryptophan, tyrosine and cystine absorb at 280 nm), from a published value, or from the rough rule that one absorbance unit is about one milligram per millilitre. It is the fastest, non-destructive way to quantify a purified protein, and its accuracy depends entirely on using the right coefficient, the right path length and a clean spectrum.
The free protein concentration A280 calculator on this page has five modes: A280 to concentration with presets (BSA, IgG, lysozyme, GFP), molar ε with molecular weight, ε0.1% or ε1%, path length and dilution; extinction coefficient and molecular weight predicted from a pasted sequence with the reduced and cystine forms and a reliability warning; nucleic-acid correction from the A260/A280 ratio with the Warburg-Christian and Kalckar formulas; a dilution, yield, recovery and aliquot planner; and mg/mL to µM conversion with molecules per microlitre and SDS-PAGE loading volumes. Each result shows the steps, a table and a chart.
Below the tool you will find the physics of the 280 nm band, the Pace method for ε, the three ways coefficients are quoted, NanoDrop and cuvette path lengths, the A260/A280 ratio and what to do about contamination, when to use a dye assay instead, worked examples, a reference table of common proteins, ten practice problems, a checklist and the questions readers ask most about the protein concentration A280 calculator.
Key Takeaway
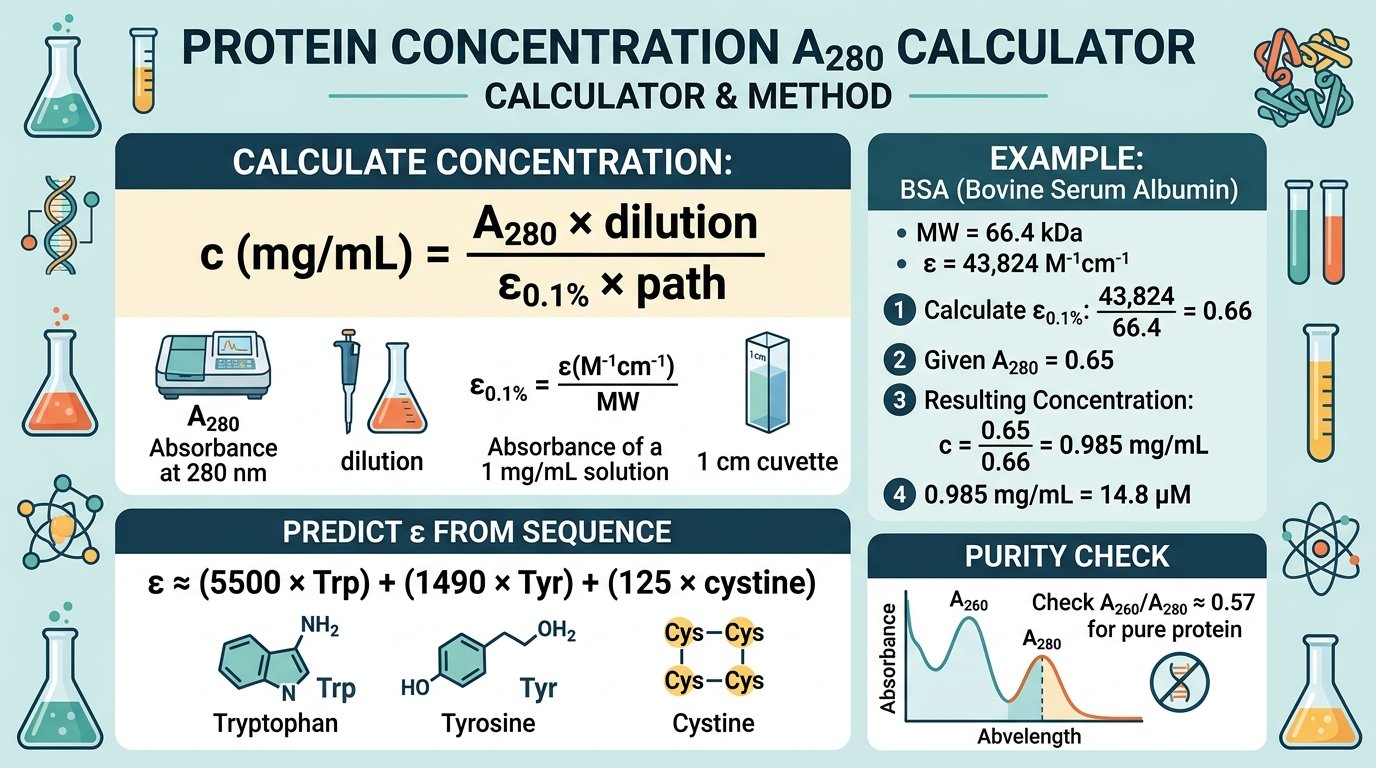
c (mg/mL) = A280 × dilution ÷ (ε0.1% × path), where ε0.1% = ε (M−1cm−1) ÷ MW is the absorbance of a 1 mg/mL solution. BSA (ε 43 824, 66.4 kDa, ε0.1% 0.66) at A280 = 0.65 is 0.985 mg/mL = 14.8 µM. Predict ε from the sequence as 5500 × Trp + 1490 × Tyr + 125 × cystine; check A260/A280 ≈ 0.57 for purity. The protein concentration A280 calculator above does all of this with the working shown.
📑 Table of Contents (click to expand)
- What Is a Protein Concentration A280 Calculator?
- How to Use the Protein Concentration A280 Calculator
- The Five Modes Explained
- Predicting ε280 From the Sequence: The Pace Method
- Worked Example: BSA at A280 = 0.65
- Three Ways Extinction Coefficients Are Quoted
- Cuvettes, NanoDrops and Path Length
- More Worked Examples
- The A260/A280 Ratio and Nucleic-Acid Correction
- When to Use a Dye Assay Instead
- Yield, Recovery and Dilution Planning
- mg/mL, µM and Molecules: Converting Units
- Buffer Components That Absorb at 280 nm
- Reference Table: Extinction Coefficients of Common Proteins
- Visualising A280
- Who Uses a Protein Concentration A280 Calculator
- Full Walkthrough: From Elution Fraction to Gel
- A Short History of Measuring Proteins by Ultraviolet Absorbance
- Limits and Assumptions
- Practice Problems With Answers
- Tips for Accurate Results
- Common Mistakes
- How This Protein Concentration A280 Calculator Is Different
- Where the Numbers Come From
- Checklist
- Frequently Asked Questions
- 10 Facts Worth Knowing
- Final Thoughts
What Is a Protein Concentration A280 Calculator?
Proteins absorb ultraviolet light near 280 nm because three of their building blocks do: tryptophan strongly (ε ≈ 5500 M−1cm−1), tyrosine moderately (1490) and the disulfide bond of cystine weakly (125). Peptide bonds absorb far more strongly but at 190–220 nm, where buffers interfere. Because every protein has a fixed number of these residues, its molar absorptivity at 280 nm is a fixed, predictable property, and the Beer-Lambert law — A = εlc — converts a single absorbance reading into a concentration without any reagent, standard curve or loss of sample. A protein concentration A280 calculator performs that conversion and supplies the coefficient.
The catch — and the reason a protein concentration A280 calculator needs a sequence mode — is that ε varies twentyfold between proteins: a tryptophan-rich lysozyme has ε0.1% = 2.65 (a 1 mg/mL solution reads A = 2.65), an average protein about 1.0, and an aromatic-poor protein such as calmodulin about 0.2. Using the generic “1 A = 1 mg/mL” rule can therefore be off by a factor of two or more in either direction. The protein concentration A280 calculator predicts the specific coefficient from the sequence, accepts published values in any of their three conventional forms, and warns when the prediction is unreliable (no tryptophan) or when the spectrum suggests contamination.
The chain of arithmetic
ε280 = 5500 nTrp + 1490 nTyr + 125 ncystine (M−1cm−1)
ε0.1% = ε280 ÷ MW (mL mg−1 cm−1, the A of 1 mg/mL)
c (mg/mL) = A280 × dilution ÷ (ε0.1% × l); c (µM) = mg/mL ÷ kDa × 1000
How to Use the Protein Concentration A280 Calculator
- Pick the mode. A280 → concentration when you have a reading; ε from sequence when you need the coefficient; Nucleic acid when the A260/A280 ratio is high; Dilution & yield to plan the next step; mg/mL ↔ µM for molar units and gel loading.
- Enter the blank-corrected A280, the path length (1 cm cuvette; 0.1 cm for a 1-mm NanoDrop reading if it is not already normalised) and any dilution.
- Supply the coefficient: choose a preset protein, or type a molar ε with the molecular weight, an ε0.1% (A of 1 mg/mL) or an ε1% (A of 10 mg/mL). If you have only the sequence, paste it into mode 2 first.
- Press Calculate. The protein concentration A280 calculator prints mg/mL and µM in blue, the coefficient used, a warning if A is outside 0.1–1.0, the steps, a table and a chart of what other coefficients would have given.
- Copy, download, print or share; each mode has its own Reset and the history box keeps ten results.
The chips load BSA in a cuvette and on a NanoDrop, IgG diluted 1 : 10, a custom ε, an antibody ε0.1%, the generic rule, EGFP and lysozyme sequences, a His-tag with no tryptophan, pure and contaminated A260/A280 cases, a yield calculation and gel-loading conversions, so the protein concentration A280 calculator’s output is visible before you type.
The Five Modes Explained
Mode 1 — A280 to concentration. Presets for BSA, human IgG, lysozyme, GFP, β-lactoglobulin, trypsin, myoglobin and the generic 1.0 and 0.5 rules, or a custom coefficient in any of three forms; path length and dilution factor; output in mg/mL, µg/mL and µM with a chart across typical ε0.1% values so you can see the sensitivity to the coefficient.
Mode 2 — ε from sequence. Counts Trp, Tyr and Cys; gives ε for the reduced and all-cystine states, the average molecular weight, ε0.1%, the aromatic share and a reliability grade (±5 % with Trp; ±10–15 % with Tyr only; unusable with neither); converts an A280 on the spot.
Mode 3 — Nucleic acid correction. A260 and A280 (with optional A320 baseline, path and dilution): the ratio, the Warburg-Christian estimate (1.55 A280 − 0.76 A260), the Kalckar estimate (1.45 A280 − 0.74 A260), the approximate nucleic-acid mass fraction and an interpretation of how far to trust the ε-based value.
Mode 4 — Dilution, yield and recovery. Stock concentration and volume, target concentration and volume, optional starting amount and aliquot size: volumes to pipette, total protein, recovery, remaining stock and aliquot count; concentration advice when the target exceeds the stock.
Mode 5 — mg/mL ↔ µM. Either direction from the molecular weight in kDa; molecules per µL; the volume for a given µg load or pmol amount; a chart of loading volumes for common gel loads.
Predicting ε280 From the Sequence: The Pace Method
Pace, Vajdos, Fee, Grimsley and Gray (1995) measured the 280 nm absorbance of 80 proteins in 6 M guanidinium chloride and fitted the simplest additive model: ε280 = 5500 × (number of Trp) + 1490 × (number of Tyr) + 125 × (number of cystine disulfides). For proteins containing tryptophan the prediction is within about 5 % of the measured value; for proteins with tyrosine but no tryptophan the error rises to 10 % or more; for proteins with neither, A280 cannot be used at all. These are the coefficients the protein concentration A280 calculator (and ExPASy ProtParam) apply.
The molecular weight in the protein concentration A280 calculator comes from the same sequence — the sum of average residue masses plus one water — and dividing ε by it gives ε0.1%, the absorbance of a 1 mg/mL solution in a 1 cm cell. Lysozyme (6 Trp, 3 Tyr, 4 S–S, 14.3 kDa) gives 37 970 M−1cm−1 and ε0.1% = 2.65; a His-tagged leader such as MHHHHHHSSGLVPRGSH has no Trp or Tyr and the tool refuses to give a coefficient. Note the choice between reduced and oxidised cysteines: for a native protein with disulfides use the cystine form; for a reduced protein in DTT use the reduced form. The difference is small (125 per bond) unless the protein is small and disulfide-rich, as insulin is.
The prediction the protein concentration A280 calculator makes assumes the protein is in a denaturing solvent; in native buffers the coefficient can differ by a few percent because buried tryptophans absorb slightly differently. For the highest accuracy measure in 6 M GdnHCl, or determine ε once by amino-acid analysis and use it thereafter. The sequence side of this arithmetic overlaps with our peptide reconstitution calculator, which uses the same residue masses.
Worked Example: BSA at A280 = 0.65
- Coefficient. BSA: ε = 43 824 M−1cm−1, MW 66 430 → ε0.1% = 43 824 / 66 430 = 0.660 mL mg−1 cm−1.
- Concentration. c = 0.65 / (0.660 × 1.00) = 0.985 mg/mL = 985 µg/mL.
- Molar. 0.65 / 43 824 = 14.8 × 10⁻⁶ M = 14.8 µM; or 0.985 / 66.43 × 1000 = 14.8 µM.
- Check. A is within 0.1–1.0; the generic rule would have said 0.65 mg/mL — 34 % low for BSA.
- On a NanoDrop with a 1 mm path the same reading means ten times as much: 9.85 mg/mL — unless the instrument has already normalised to 10 mm, which most do. Enter the path the software reports.
The protein concentration A280 calculator prints this chain and a bar chart showing what ε0.1% values of 0.5, 1.0, 1.4 and 2.0 would have returned for the same absorbance — a visual reminder that the coefficient, not the spectrophotometer, is usually the largest source of error. The underlying law is covered in full in our Beer Lambert law calculator.
Three Ways Extinction Coefficients Are Quoted
| Form | Units | Meaning | BSA example |
|---|---|---|---|
| Molar ε | M−1 cm−1 | A of a 1 M solution | 43 824 |
| ε0.1% (E0.1%, mass ε) | mL mg−1 cm−1 = L g−1 cm−1 | A of a 1 mg/mL solution | 0.66 |
| ε1% (E1%1cm, A2801%) | (g/100 mL)−1 cm−1 | A of a 10 mg/mL solution | 6.6 |
Antibody data sheets, which the protein concentration A280 calculator accepts directly, say “E1% = 14″ (so 1 mg/mL reads 1.4); enzyme papers quote molar ε; supplier certificates often give ε0.1%. The relationships are ε0.1% = ε / MW and ε1% = 10 ε0.1%. The protein concentration A280 calculator takes any of the three explicitly and shows the other two, so a tenfold or a molecular-weight slip is caught before it reaches the notebook. The commonest error in practice is entering an ε1% as if it were ε0.1%, which under-reports the concentration by a factor of ten.
Cuvettes, NanoDrops and Path Length
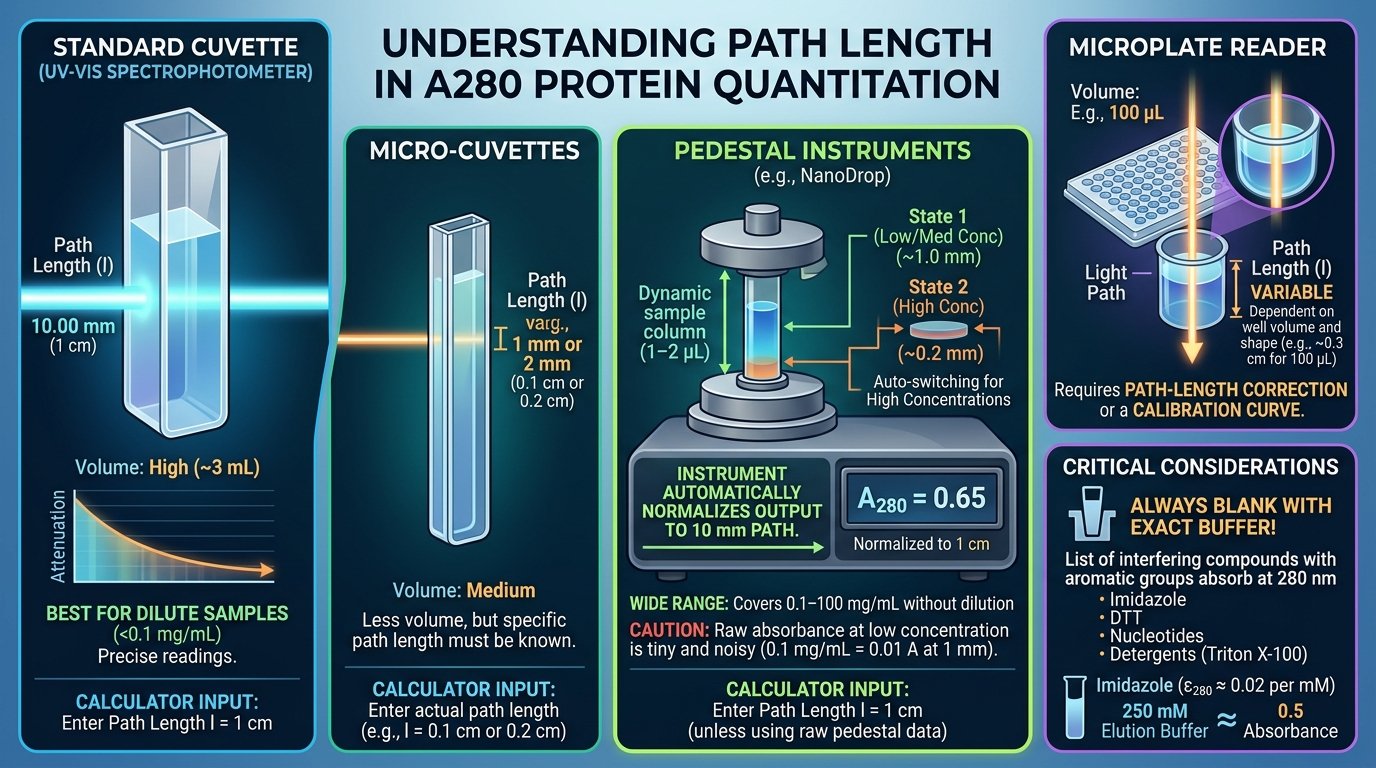
Beer-Lambert is linear in path length, so the protein concentration A280 calculator asks for it explicitly: so the instrument’s optical path must be known. Standard cuvettes are 10.00 mm; semi-micro and ultra-micro cells are also 10 mm but hold less; some micro-cells are 1 or 2 mm. Pedestal instruments (NanoDrop and its relatives) measure 1–2 µL at paths of 1.0 and 0.2 mm, automatically choosing the shorter path for concentrated samples, and report the absorbance normalised to a 10 mm path. So a NanoDrop “A280 = 0.65” already means 0.65 per cm, and the protein concentration A280 calculator should be given l = 1 cm; only when you are working from raw pedestal data or a genuine 1-mm cuvette should you enter 0.1 cm.
The short path is why pedestal instruments, whose readings the protein concentration A280 calculator accepts as 10-mm equivalents, cover 0.1–100 mg/mL (for ε0.1% = 1) without dilution, but it also means the raw absorbance of a dilute sample is tiny (0.1 mg/mL is 0.01 A at 1 mm) and noisy; below about 0.1 mg/mL a cuvette or a dye assay is more precise. Microplate readers have a path set by the well volume (roughly 0.3 cm for 100 µL in a 96-well plate) and need either a path-length correction or a calibration curve. Whatever the instrument, blank with the exact buffer, because imidazole (ε280 ≈ 0.02 per mM — 250 mM elution buffer reads 0.5 A), DTT, nucleotides and detergents with aromatic groups (Triton X-100) all absorb at 280 nm.
More Worked Examples
Example 1 — IgG, A = 1.2 after 1 : 10 dilution
ε0.1% = 1.40; c = 1.2 × 10 / 1.40 = 8.57 mg/mL = 57 µM (150 kDa).
Example 2 — Custom ε 27 500, 31 kDa, A = 0.42
ε0.1% = 27 500 / 31 000 = 0.887; c = 0.42 / 0.887 = 0.473 mg/mL = 15.3 µM.
Example 3 — EGFP from sequence
1 Trp, 11 Tyr, 2 Cys (reduced): ε = 5500 + 16 390 = 21 890 M−1cm−1; MW 26.9 kDa; ε0.1% = 0.81 — but the chromophore adds absorbance near 280 nm too, so measured values run higher (about 22 000–24 000).
Example 4 — Contaminated lysate, A260 0.78, A280 0.65
Ratio 1.20 (about 3 % nucleic acid); Warburg-Christian protein = 1.55 × 0.65 − 0.76 × 0.78 = 0.41 mg/mL, versus 0.98 mg/mL uncorrected — A280 alone over-reads by more than double.
Example 5 — Gel loading
2.5 mg/mL BSA = 37.7 µM; 20 µg for a Coomassie lane is 8 µL; 100 pmol is 2.66 µL.
The A260/A280 Ratio and Nucleic-Acid Correction
Nucleic acids absorb about ten times more strongly at 260 nm than proteins do per unit mass — the reason the protein concentration A280 calculator has a correction mode — and they still absorb appreciably at 280 nm, so even a small contamination inflates a protein A280 reading. The ratio A260/A280 diagnoses it: pure protein gives about 0.57 (it varies 0.5–0.75 with aromatic content), pure DNA 1.8, pure RNA 2.0, and the ratio climbs quickly with contamination — 1 % nucleic acid by mass already raises it to about 0.9, 5 % to about 1.4. The protein concentration A280 calculator’s mode 3 reports the ratio and an approximate nucleic-acid mass fraction interpolated from published curves.
Warburg & Christian (1941): protein (mg/mL) = 1.55 A280 − 0.76 A260
Kalckar (1947) / Layne (1957): protein (mg/mL) = 1.45 A280 − 0.74 A260
Both assume an average protein (ε0.1% ≈ 1) and average nucleic acid; accuracy ±20 % at best.
The corrections in the protein concentration A280 calculator rescue a reading with a few percent of nucleic acid; they do not rescue a crude lysate at a ratio of 1.5 or more, where a dye-binding assay (Bradford, BCA) or nuclease treatment followed by re-measurement is the honest route. A raised baseline at 320–350 nm, where neither protein nor nucleic acid absorbs, signals aggregation or particulates, which inflate both wavelengths; the tool subtracts an optional A320 before computing. For the nucleic-acid side of the same measurement (A260 × 50 µg/mL for DNA) see the Beer Lambert law calculator.
When to Use a Dye Assay Instead
A protein concentration A280 calculator is ideal for a purified protein of known sequence in a non-absorbing buffer. It is the wrong choice when the protein has no tryptophan (or very few aromatics), when the sample is a mixture of unknown composition (a lysate, a serum), when nucleic acid or absorbing additives are present, when the concentration is below about 0.05 mg/mL in a cuvette, or when the buffer itself absorbs (imidazole, DTT, some detergents). In those cases a colorimetric assay — Bradford (Coomassie binding, fast, detergent-sensitive), BCA (copper reduction, detergent-tolerant, reducing-agent-sensitive) or Lowry — against a standard curve of BSA or, better, of the protein itself is more appropriate, and the calibration statistics live in the Beer Lambert law calculator’s curve mode.
Conversely, the protein concentration A280 calculator beats the dye assays for absolute accuracy when the coefficient is right, because dye assays respond differently to different proteins (Bradford can vary twofold between proteins with the same mass) and are only as good as the standard. A useful practice is to measure a purified protein by A280 with its sequence-derived coefficient and use that stock to calibrate the dye assay for later, dirtier samples. The protein concentration A280 calculator’s reliability grade in mode 2 tells you which side of the line your protein falls.
Yield, Recovery and Dilution Planning
Once the concentration is known, the rest is bookkeeping that the protein concentration A280 calculator’s mode 4 does in one pass: total protein = concentration × volume (4.8 mg/mL × 2.5 mL = 12 mg); recovery = total ÷ starting amount (12 / 40 mg = 30 %, typical for a multi-step purification); the volumes for a working dilution by C1V1 = C2V2 (1 mL at 1 mg/mL needs 208 µL of stock + 792 µL buffer); what remains afterwards; and how many aliquots of a chosen size the stock makes. If the target concentration exceeds the stock, the tool explains the centrifugal-concentrator arithmetic instead.
Two cautions accompany the protein concentration A280 calculator’s numbers. Dilute proteins adsorb to surfaces — below about 0.1 mg/mL add carrier protein or use low-bind tubes, and re-measure after dilution when it matters. And record the concentration with the method: “2.3 mg/mL by A280, ε0.1% 0.92 from sequence” is reproducible; “2.3 mg/mL” alone is not. The general dilution arithmetic is in our dilution calculator; aliquot planning appears in the stock solution calculator as well.
mg/mL, µM and Molecules: Converting Units
Binding studies, enzyme kinetics and structural work need molar concentrations, so the protein concentration A280 calculator converts them; gels and Westerns need micrograms. The conversion is µM = mg/mL ÷ kDa × 1000 (equivalently mg/mL = µM × kDa ÷ 1000): 2.5 mg/mL of a 66.4 kDa protein is 37.7 µM; 10 µM of a 150 kDa antibody is 1.5 mg/mL; 1 µM lysozyme is only 14.3 µg/mL. Multiplying µM by 6.022 × 10⁸ gives molecules per microlitre — 2.3 × 10¹⁰ for the BSA stock — a number single-molecule and surface-binding experiments use directly.
Loading volumes follow from the mass concentration: 20 µg from 2.5 mg/mL is 8 µL; 5 µg of a 0.8 mg/mL GFP is 6.25 µL. Typical loads are 0.5–2 µg per band for Coomassie, 10–50 ng for silver stain, and 10–50 µg of lysate or 1–100 ng of purified protein for a Western. The protein concentration A280 calculator’s mode 5 does the conversion in both directions and returns the volume for any load in µg or pmol; for the general relationship between mass and molar concentration see the molarity calculator.
Buffer Components That Absorb at 280 nm
| Component | Typical concentration | Approx. A280 (1 cm) | Remedy |
|---|---|---|---|
| Imidazole | 250 mM | ~0.5 | Blank with buffer; desalt |
| DTT (oxidised) | 1–5 mM | 0.1–0.5 (rises with age) | Fresh DTT; TCEP instead |
| Triton X-100 | 0.1 % | ~1.5 | Use Tween/CHAPS; dye assay |
| ATP / NADH / nucleotides | 1 mM | 2–15 | Remove before A280 |
| Glycerol, NaCl, Tris, HEPES, EDTA | usual | < 0.05 | Blank correction suffices |
Because the blank is subtracted before the protein concentration A280 calculator sees the number, a constant absorbing component is harmless as long as the blank contains exactly the same amount; the trouble starts when the sample and blank differ (a gradient elution, an aged DTT stock) or when the component absorbs so strongly that the total exceeds the instrument’s range. The protein concentration A280 calculator cannot see your buffer, so the table above — and a full spectrum — are the safeguards.
Reference Table: Extinction Coefficients of Common Proteins
| Protein | MW (kDa) | ε (M−1cm−1) | ε0.1% | mg/mL at A = 1 |
|---|---|---|---|---|
| Bovine serum albumin | 66.4 | 43 824 | 0.66 | 1.52 |
| Human IgG | 150 | 210 000 | 1.40 | 0.71 |
| Hen lysozyme | 14.3 | 37 970 | 2.65 | 0.38 |
| EGFP | 26.9 | ~22 000 | 0.82 | 1.22 |
| Trypsin (bovine) | 23.3 | 35 700 | 1.53 | 0.65 |
| β-Lactoglobulin | 18.4 | 17 600 | 0.96 | 1.04 |
| Myoglobin (apo) | 17.0 | 13 980 | 0.82 | 1.22 |
| Ovalbumin | 42.7 | 30 590 | 0.72 | 1.39 |
| Calmodulin | 16.7 | 2 980 | 0.18 | 5.6 |
| Insulin (human) | 5.8 | 6 335 | 1.09 | 0.92 |
Values are sequence-based (Pace) or widely used literature figures; use your own protein’s sequence in mode 2 of the protein concentration A280 calculator, and note the twentyfold spread between calmodulin and lysozyme.
Visualising A280
Think of each tryptophan the protein concentration A280 calculator counts as a bright ultraviolet target and each tyrosine as a dim one: a protein’s absorbance at 280 nm is the number of targets times their brightness times how many proteins are in the light path. Two proteins at the same mg/mL can differ tenfold in absorbance simply because one is studded with tryptophans and the other has none, which is the whole reason a sequence-specific coefficient matters. The protein concentration A280 calculator’s chart of ε280 contributions makes the Trp/Tyr/cystine split visible for your sequence.
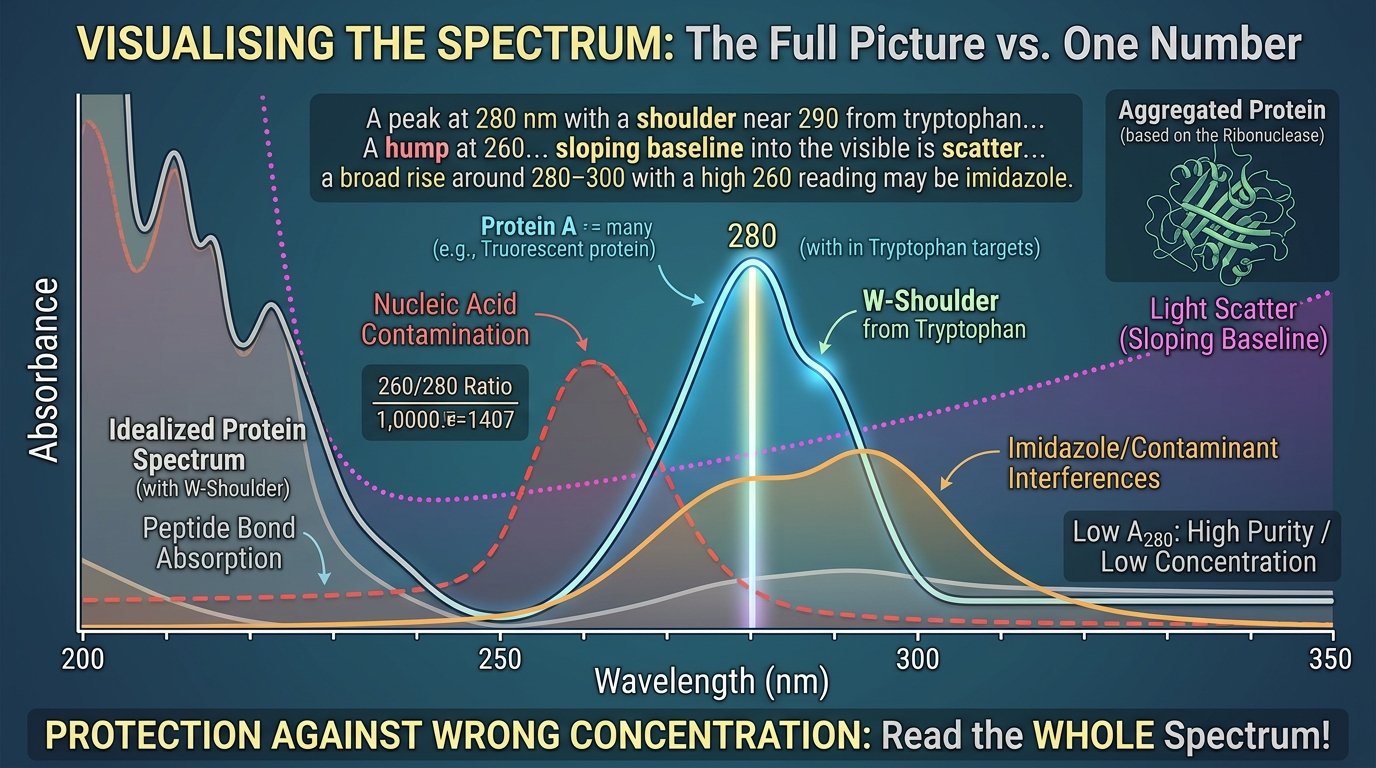
The second picture, which the protein concentration A280 calculator cannot see but you can, is the spectrum itself: a peak at 280 nm with a shoulder near 290 from tryptophan, a minimum near 250, a steep rise below 240 from the peptide bonds, and a flat baseline at 320–350. A hump at 260 that lifts the 260/280 ratio is nucleic acid; a sloping baseline into the visible is scatter; a broad rise around 280–300 with a high 260 reading may be imidazole. Reading the whole spectrum, not just one number, is the best protection against a wrong concentration.
Who Uses a Protein Concentration A280 Calculator
Protein biochemists and purification cores quantify every fraction and pool. Structural biologists set crystallisation and NMR concentrations in mg/mL and mM. Antibody laboratories use ε1% = 14 for IgG many times a day. Cell biologists measure lysates before loading gels and correct for nucleic acid. Enzymologists need molar enzyme concentrations for kcat. Students learn the Beer-Lambert law on proteins because the measurement is quick and non-destructive.
The protein concentration A280 calculator gives each of them the coefficient in the form they have, the concentration in the units they need, and the diagnostics — reliability grade, 260/280 ratio, absorbance window — that decide whether the number can be trusted.
Full Walkthrough: From Elution Fraction to Gel
A His-tagged enzyme (sequence known: 3 Trp, 12 Tyr, 4 Cys reduced, 38.2 kDa) elutes in 250 mM imidazole. Pooled fractions: 2.5 mL. Starting lysate contained about 40 mg of total protein.
- Coefficient (protein concentration A280 calculator, mode 2): ε = 3 × 5500 + 12 × 1490 = 34 380 M−1cm−1; ε0.1% = 0.90; reliability ±5 % (Trp present).
- Blank properly. Read against the imidazole elution buffer, not water — imidazole alone would add ~0.5 A. A280 = 0.86, A260 = 0.50, A320 = 0.01 after a 1 : 5 dilution.
- Purity check (mode 3): ratio 0.58 — pure; no correction needed.
- Concentration (mode 1): (0.86 − 0.01) × 5 / 0.90 = 4.72 mg/mL = 124 µM.
- Yield (mode 4): 4.72 × 2.5 = 11.8 mg; recovery 30 %; 1 mL at 1 mg/mL for assays takes 212 µL of stock; 50 µL aliquots × 45 for the freezer.
- Gel (mode 5): 5 µg per lane from the 1 mg/mL working solution is 5 µL.
- Record: “4.72 mg/mL by A280 (ε0.1% 0.90, sequence-derived), 260/280 0.58, imidazole blank”; export the tables.
A Short History of Measuring Proteins by Ultraviolet Absorbance
The measurement behind every protein concentration A280 calculator began when the ultraviolet absorption of proteins was recognised in the 1920s and attributed to the aromatic amino acids by the 1930s. Otto Warburg and Walter Christian published their 280/260 nm method in 1941 as a way to measure enzyme (protein) concentration in the presence of nucleic acid during purification of yeast enolase; their coefficients are still in every textbook. Kalckar (1947) and Layne (1957) refined them. Gill and von Hippel (1989) showed that ε280 could be predicted additively from Trp, Tyr and cystine counts, and Pace and colleagues (1995) calibrated the coefficients on 80 proteins, producing the 5500/1490/125 set used by ExPASy and by this protein concentration A280 calculator.
Instrumentally, quartz cuvettes in Beckman’s DU spectrophotometer (1941) made routine A280 possible; the pedestal microvolume spectrophotometer (NanoDrop, 2001) made it a two-microlitre, ten-second measurement. The arithmetic has not changed; the sample volume has fallen a thousandfold.
Limits and Assumptions
- Sequence-based ε from the protein concentration A280 calculator is ±5 % with Trp, ±10–15 % with Tyr only, unusable without either; chromophores, prosthetic groups (haem, flavin) and PEG change it.
- Blank must match the buffer; imidazole, DTT, nucleotides and some detergents absorb at 280 nm.
- Nucleic-acid corrections are ±20 % and fail above ~5 % contamination.
- Path length must be the value your instrument actually reports (most pedestal readers normalise to 10 mm).
- Absorbance window 0.1–1.0 in a cuvette; pedestal readers extend it but lose precision below ~0.1 mg/mL.
- Native vs denatured: predicted coefficients refer to 6 M GdnHCl; native buffers differ by a few percent.
Practice Problems With Answers
Work these by hand, then check with the protein concentration A280 calculator.
- A = 0.80, ε0.1% = 1.0, 1 cm: mg/mL? Answer: 0.80 mg/mL.
- A = 0.45, ε = 30 000, MW 45 kDa: mg/mL and µM? Answer: 0.675 mg/mL; 15 µM.
- IgG (ε1% = 14), A = 0.7: mg/mL? Answer: 0.50 mg/mL.
- Sequence with 4 Trp, 10 Tyr, 2 S–S: ε? Answer: 37 150 M−1cm−1.
- That protein at 50 kDa: ε0.1%? Answer: 0.743.
- A280 0.6, A260 0.9: ratio and Warburg-Christian protein? Answer: 1.5; 0.246 mg/mL.
- NanoDrop raw 1-mm reading 0.12: 10-mm equivalent? Answer: 1.2.
- 3.2 mg/mL × 1.5 mL from 25 mg start: yield and recovery? Answer: 4.8 mg; 19 %.
- 10 µM of a 25 kDa protein: mg/mL? Answer: 0.25 mg/mL.
- 15 µg for a lane from 1.8 mg/mL: volume? Answer: 8.3 µL.
Tips for Accurate Results
- Derive ε from the exact construct sequence (tags included); the protein concentration A280 calculator does it in seconds.
- Blank with the identical buffer; re-blank after buffer exchange.
- Scan 240–350 nm, not just 280: check the 260/280 ratio and the 320–350 baseline.
- Keep A between 0.1 and 1.0 in a cuvette; dilute in the same buffer.
- Use quartz or UV-transparent plastic cuvettes below 300 nm.
- Enter the path your instrument reports (usually 10-mm normalised).
- Report the coefficient and method with every concentration.
- Cross-check one stock by a second method (BCA, amino-acid analysis) for critical work.
Common Mistakes
- Using 1 A = 1 mg/mL for a protein with ε0.1% of 0.4 or 2.6 — the protein concentration A280 calculator’s chart shows the spread.
- Entering ε1% as ε0.1% — tenfold error.
- Blanking with water when the sample is in imidazole or DTT.
- Ignoring a 260/280 ratio above 0.8.
- Applying a 0.1 cm path to a NanoDrop reading that is already normalised.
- Trusting A280 for a Trp-free protein.
- Forgetting the dilution factor, or applying it twice.
- Reading a scattering, aggregated sample without a baseline check.
How This Protein Concentration A280 Calculator Is Different
| Feature | This protein concentration A280 calculator | Typical online calculator |
|---|---|---|
| A280 → mg/mL and µM with presets, molar ε, ε0.1% or ε1% | ✓ | 1 A = 1 mg/mL only |
| ε280, MW and ε0.1% from sequence with reduced/cystine forms and reliability grade | ✓ | ✗ |
| Path length and dilution factor handled explicitly (NanoDrop vs cuvette) | ✓ | Partial |
| A260/A280 ratio, Warburg-Christian and Kalckar corrections, nucleic-acid estimate, A320 baseline | ✓ | ✗ |
| Yield, recovery, dilution volumes and aliquots | ✓ | ✗ |
| mg/mL ↔ µM, molecules/µL and gel-loading volumes | ✓ | ✗ |
| Absorbance-window and buffer-interference warnings | ✓ | ✗ |
| Steps, table, chart, copy, CSV, print, share, history, per-mode Reset | ✓ | Number only |
Most A280 tools apply one fixed coefficient. This protein concentration A280 calculator derives the coefficient from your sequence, accepts it in any published form, checks the spectrum for contamination and carries the result through to yield, molarity and the gel.
The protein concentration A280 calculator belongs to the same family as the site’s other free tools: molecular weight calculator, atomic mass calculator, formula weight calculator, molarity calculator, stoichiometry calculator, exact mass calculator, grams to moles calculator, molar mass of hydrates calculator, average molecular weight of a mixture, number average molecular weight, weight average molecular weight, polydispersity index, monoisotopic mass calculator, average vs monoisotopic mass, isotopic mass calculator, freezing point depression, boiling point elevation, osmotic pressure calculator, vapor density, molar mass from gas density, equivalent weight calculator, viscosity molecular weight, van der Waals equation, empirical formula calculator, molecular formula calculator, percent composition calculator, combustion analysis calculator, degree of unsaturation calculator, oxidation number calculator, formal charge calculator, limiting reactant calculator, theoretical yield calculator, percent yield calculator, atom economy calculator, chemical equation balancer, molality calculator, normality calculator, mole fraction calculator, ppm to ppb converter, dilution calculator, serial dilution calculator, solution preparation calculator, w/v solution calculator, ionic strength calculator, osmolarity calculator, peptide reconstitution calculator, stock solution calculator, Beer Lambert law calculator.
Where the Numbers Come From
The protein concentration A280 calculator uses the Pace coefficients for ε280, average residue masses from IUPAC 2021 atomic weights, the Warburg-Christian and Kalckar formulas, and published extinction coefficients for its presets:
- Pace, Vajdos, Fee, Grimsley & Gray, Protein Science 1995 — How to measure and predict the molar absorption coefficient of a protein: the 5500 / 1490 / 125 M−1cm−1 coefficients and their accuracy.
- ExPASy ProtParam (SIB): the reference implementation of sequence-based molecular weight and extinction coefficient; mode 2 follows the same conventions.
- NCBI Bookshelf — Protein Quantitation (Current Protocols / methods compendium): A280, Warburg-Christian correction, Bradford, BCA and Lowry methods compared.
- Wikipedia — Protein quantification: overview of absorbance and colorimetric methods, the A260/A280 ratio and their limitations.
Found an error? Our corrections policy explains how we handle reports; contact us or read about the site.
Checklist
☐ ε derived from the exact sequence (or taken from a reliable source) and its form identified (molar, 0.1 %, 1 %)
☐ Reduced vs cystine state chosen to match the sample
☐ Blank = the exact sample buffer; imidazole/DTT/detergent interference considered
☐ Spectrum scanned 240–350 nm; A320 baseline ≈ 0
☐ A260/A280 ≈ 0.5–0.7; corrected or re-purified if higher
☐ A280 between 0.1 and 1.0 (cuvette); dilution recorded
☐ Path length = value the instrument reports
☐ Concentration reported with coefficient and method
☐ Yield and recovery logged; aliquots planned
☐ Second method used for Trp-poor proteins or critical stocks
Frequently Asked Questions
How do I calculate protein concentration from A280?
c (mg/mL) = A280 × dilution ÷ (ε0.1% × path length), where ε0.1% is the absorbance of a 1 mg/mL solution (molar ε divided by molecular weight). BSA with A = 0.65 in 1 cm: 0.65 / 0.66 = 0.985 mg/mL.
Is 1 absorbance unit equal to 1 mg/mL of protein?
Only roughly. The true value ranges from about 0.4 mg/mL (Trp-rich proteins like lysozyme) to over 5 mg/mL (Trp-free proteins like calmodulin). Use a sequence-derived or published coefficient whenever possible.
How do I find the extinction coefficient of my protein?
From the sequence: ε280 = 5500 × Trp + 1490 × Tyr + 125 × cystine (Pace et al. 1995). Divide by the molecular weight for ε0.1%. The calculator’s sequence mode does this and grades the reliability.
What is the difference between ε, ε0.1% and ε1%?
ε is per mol/L (M−1cm−1); ε0.1% is the absorbance of 1 mg/mL (= ε / MW); ε1% is the absorbance of 10 mg/mL (= 10 × ε0.1%). IgG’s E1% of 14 means 1 mg/mL reads 1.4.
What should the A260/A280 ratio be for a pure protein?
About 0.57 (range 0.5–0.75 depending on aromatic content). Values above 0.8 indicate nucleic-acid contamination; pure DNA is 1.8 and RNA 2.0. Use the Warburg-Christian correction for mild contamination or a dye assay for heavy contamination.
How do I correct A280 for nucleic acid?
Warburg-Christian: protein (mg/mL) = 1.55 × A280 − 0.76 × A260. It assumes an average protein and is accurate to about ±20 %; for ratios above ~1.2 use Bradford or BCA instead.
Do I enter 0.1 cm for a NanoDrop reading?
Usually not: pedestal instruments report absorbance normalised to a 10 mm path, so enter 1 cm. Enter 0.1 cm only for raw 1-mm data or a true 1-mm cuvette.
Why is my A280 reading high in imidazole elution buffer?
Imidazole absorbs at 280 nm (about 0.02 A per mM at 1 cm), so 250 mM adds roughly 0.5 A. Blank against the identical buffer or exchange the buffer before measuring. DTT, nucleotides and Triton X-100 also absorb.
How do I convert mg/mL to µM for a protein?
µM = mg/mL ÷ molecular weight in kDa × 1000. 2.5 mg/mL of a 66.4 kDa protein is 37.7 µM; 1 mg/mL of a 150 kDa antibody is 6.7 µM.
Is my data stored anywhere?
No. The protein concentration A280 calculator runs entirely in your browser; the history box uses your own local storage and Clear All empties it.
10 Facts Worth Knowing
- Tryptophan absorbs almost four times more strongly at 280 nm than tyrosine, and a disulfide bond forty-four times less than tryptophan.
- Lysozyme’s ε0.1% of 2.65 and calmodulin’s 0.18 differ fifteenfold — the range hidden behind “1 A = 1 mg/mL”.
- Warburg and Christian’s 1941 correction was devised to follow enolase through a yeast purification full of nucleic acid.
- 250 mM imidazole reads about 0.5 A at 280 nm on its own — a whole protein’s worth of absorbance.
- A NanoDrop’s 0.2 mm path lets it read up to ~100 mg/mL of protein, fifty times a cuvette’s range, from 1 µL.
- Peptide bonds absorb at 205–215 nm with ε ≈ 7000 per bond, so A205 quantifies Trp-free proteins — if the buffer permits.
- The 260/280 ratio of pure protein varies from 0.5 to 0.75 depending on how many tyrosines and tryptophans it has.
- GFP’s chromophore adds ultraviolet absorbance near 280 nm, so its measured ε exceeds the Pace prediction.
- Pace’s 1995 calibration set was 80 proteins measured in 6 M guanidinium chloride, where every aromatic is exposed.
- One milligram per millilitre of a 50 kDa protein is 20 µM — 1.2 × 10¹⁰ molecules in every microlitre.
Final Thoughts
A280 is the Beer-Lambert law applied to tryptophan and tyrosine. Get the coefficient right — from the sequence or a trusted source, in the correct form — blank with the real buffer, read the whole spectrum, keep the absorbance in range, and the number is as good as any protein assay and faster than all of them.
Use the protein concentration A280 calculator above to convert readings, predict coefficients, check purity, plan dilutions and yields and convert to molar units — and record the coefficient with every concentration you report.
Written by
Ahmad Raza, M.Phil. Chemistry ✓ Verified Expert
Ahmad has taught general and analytical chemistry for over a decade and builds the calculators on this site. He tests every tool — including this protein concentration A280 calculator — against published extinction coefficients, textbook problems and bench measurements before it goes live, and he answers reader questions personally.