
Average vs Monoisotopic Mass Calculator
The two masses of every molecule, side by side: the average mass your balance weighs (IUPAC atomic weights) and the monoisotopic mass your mass spectrometer reads (exact top-isotope masses). Compare them for any formula or peptide, see which elements create the gap, and find out exactly how many ppm you lose by searching with the wrong one.
✓ Trusted by students, teachers & lab professionalsAverage vs Monoisotopic Mass from a Formula
One formula, two answers: the average mass (all isotopes, abundance-weighted — weighing & stoichiometry) and the monoisotopic mass (most abundant isotope only — high-resolution MS peaks). Parentheses and hydrates work: Cu(NO3)2, CuSO4·5H2O.
Peptide: Average AND Monoisotopic Mass
Type the one-letter sequence (20 standard amino acids). Both masses are built the same way — Σ residue masses + H₂ O for the free termini — but from two different residue tables. Assumes unmodified, uncharged termini.
Gap Anatomy — Which Elements Create the Difference?
The average–monoisotopic gap is not spread evenly: each element contributes count × (atomic weight − top-isotope mass). Carbon’s ¹³C usually dominates. See every element’s share.
The Wrong-Mass Penalty (in ppm)
What happens if you search a high-resolution spectrum with the average mass instead of the monoisotopic one? Enter your formula and your search tolerance — the tool shows the ppm penalty and whether the match would survive.
Two Formulas, Four Masses — Isobar Check
Compare any two formulas side by side: nominal, monoisotopic and average for each, plus the mono-mass difference in millidaltons. Same nominal mass but different exact masses? Those are isobars — only accurate mass can separate them.
🕘 Recent calculations
- No calculations yet — your last 10 results will appear here.
Average mass: IUPAC 2021 atomic weights · Monoisotopic mass: AME/CODATA exact isotope masses · Free tool by molecularweightcalculator.org
The average vs monoisotopic mass question is the single most common source of confusion in mass spectrometry — and the calculator above settles it in one click. Type C6H12O6 and both answers appear side by side: the average mass 180.156 g/mol (what a balance weighs) and the monoisotopic mass 180.0634 Da (what a high-resolution mass spectrometer reads), with the 0.0926 Da gap between them dissected element by element.
The free tool above goes well beyond a two-number comparison. Five modes cover every angle of the average vs monoisotopic mass decision: both masses from any chemical formula, both masses for peptide sequences (from two separate residue tables), the gap anatomy showing exactly which elements create the difference, the wrong-mass ppm penalty that tells you what searching with the average mass would cost you, and a two-formula isobar comparison in millidaltons. Each mode has its own ↺ Reset button, and every result can be copied, downloaded, printed or shared.
In this guide I’ll define both masses properly, show why they drift apart as molecules grow, derive the gap arithmetic from the isotope table up, walk through the classic worked examples (glucose, PEPTIDE, aspirin-vs-glucose isobars), and finish with the practice problems examiners recycle every year. Let’s begin.
🔑 KEY TAKEAWAY
The average mass weights every isotope by natural abundance (C = 12.011, H = 1.008) — it’s what a balance weighs; use it for stoichiometry and molarity. The monoisotopic mass sums only the most abundant isotope of each element at its exact mass (¹²C = 12, ¹H = 1.00782503) — it’s where the first high-resolution MS peak lands. Glucose: average 180.156 g/mol vs monoisotopic 180.0634 Da, a 0.0926 Da gap driven ~71% by carbon-13. Rule: spectra speak monoisotopic, balances speak average — never mix them in one calculation.
📑 Table of Contents (click to expand)
- Average vs Monoisotopic Mass: The Two Currencies
- How to Use This Calculator
- The Five Modes Explained
- The Formulas (With the Box You Should Memorize)
- Which Mass Should You Use? The Decision Table
- Gap Anatomy: Why Carbon Runs the Show
- Three Worked Examples, Step by Step
- Reference Table: 10 Compounds, Both Masses
- What Instruments See: Envelopes, Isobars & Resolution
- Who Needs the Average vs Monoisotopic Distinction?
- Full Lab Walkthrough: The Wrong-Mass Mistake, Fixed
- A Short History: From Whole Numbers to Two Masses
- The Two Masses in Everyday Life
- Practice Problems (With Answers)
- Tips for Fast, Error-Free Work
- 5 Common Mistakes to Avoid
- How This Calculator Is Different
- Where the Numbers Come From
- Exam Checklist
- Frequently Asked Questions
- 10 Facts Worth Knowing
Average vs Monoisotopic Mass: The Two Currencies
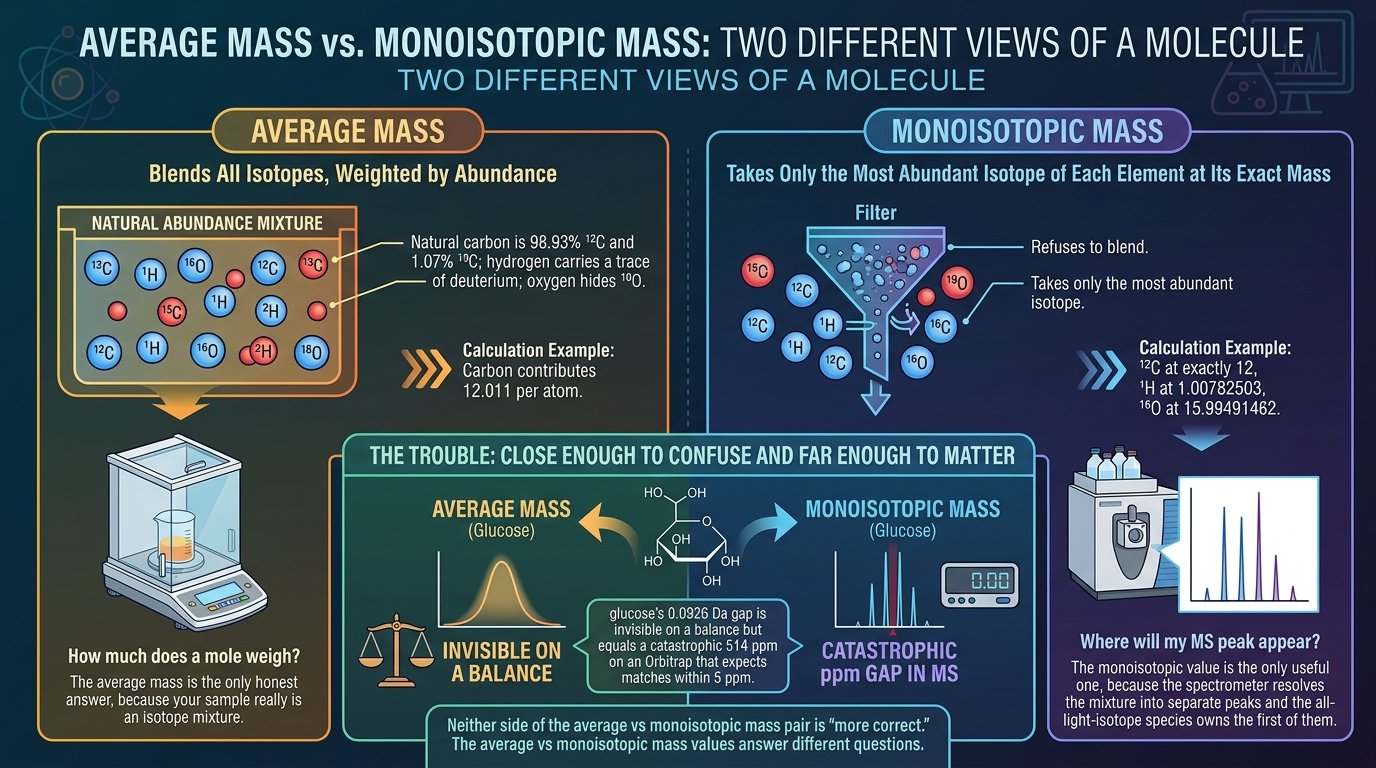
Every molecule carries two legitimate masses, and the entire average vs monoisotopic mass debate comes down to which isotopes you count. Natural carbon is 98.93% ¹²C and 1.07% ¹³C; hydrogen carries a trace of deuterium; oxygen hides ¹⁸O. The average mass blends all of them, weighted by abundance — carbon contributes 12.011 per atom, and a mole of the compound genuinely weighs this much on a balance. The monoisotopic mass refuses to blend: it takes only the most abundant isotope of each element at its exact mass — ¹²C at exactly 12, ¹H at 1.00782503, ¹⁶O at 15.99491462 — and lands precisely where the first peak of a high-resolution mass spectrum sits.
Neither side of the average vs monoisotopic mass pair is “more correct.” The average vs monoisotopic mass values answer different questions. Ask “how much does a mole weigh?” and the average is the only honest answer, because your sample really is an isotope mixture. Ask “where will my MS peak appear?” and the monoisotopic value is the only useful one, because the spectrometer resolves the mixture into separate peaks and the all-light-isotope species owns the first of them.
The average vs monoisotopic mass trouble starts because the two numbers are close enough to confuse and far enough to matter: glucose’s 0.0926 Da gap is invisible on a balance but equals a catastrophic 514 ppm on an Orbitrap that expects matches within 5 ppm. That is why the average vs monoisotopic mass distinction is drilled in every analytical course — and why this site keeps the two currencies in separate tools: everyday average masses live in the molecular weight calculator on the homepage, exact-mass work in the monoisotopic mass calculator, while the calculator above puts both side by side.
How to Use This Calculator
Settling an average vs monoisotopic mass question takes under ten seconds:
- Pick an average vs monoisotopic mass mode from the five tabs — Average vs Mono, Peptide Both Masses, Gap Anatomy, Wrong-Mass Penalty, or Two Formulas.
- Enter your data — a formula like C8H10N4O2 (parentheses and hydrate dots work), a one-letter peptide sequence, or two formulas for the isobar check. The preset chips load classic examples in one click.
- Press the blue button (or hit Enter). Both masses appear with the gap in Da and percent, a full contribution table and an animated comparison graph.
- Read the average vs monoisotopic mass verdicts — which elements drive the gap, how many ppm the wrong mass would cost against your search tolerance, or whether two formulas are isobars.
- Copy, download or share the result — CSV, TXT, print, WhatsApp, Facebook or X — and press ↺ Reset to start the next compound clean.
Your last ten calculations are saved in the history panel under the tool (stored only in your own browser), and Clear All wipes them instantly. Nothing is sent to any server — the whole average vs monoisotopic mass comparison runs on your device, which is also why the page loads fast and works offline once open.
The Five Modes Explained
⚖️ Mode 1 — Average vs Mono from a Formula
The headline average vs monoisotopic mass act: one formula, two masses, one gap. Caffeine C8H10N4O2 returns average 194.194 g/mol vs monoisotopic 194.0804 Da — a 0.1136 Da difference — with a per-element table showing each element’s top-isotope mass, atomic weight and gap contribution.
🧬 Mode 2 — Peptide: Both Masses
Proteomics reports monoisotopic values; older protein literature and SDS-PAGE-era tables speak average. This average vs monoisotopic mass mode builds both from one-letter sequences using two residue tables: PEPTIDE gives monoisotopic 799.3599 Da and average 799.8328 — a 0.4729 Da gap after only seven residues. Invalid letters are caught instantly.
🔍 Mode 3 — Gap Anatomy
The average vs monoisotopic mass gap is not spread evenly across the formula. Each element contributes count × (atomic weight − top-isotope mass), and this mode ranks them: for glucose, carbon supplies 0.066 Da of the 0.0926 Da total — 71.3% — because of its 1.07% natural ¹³C. Oxygen adds most of the rest; hydrogen barely registers.
🚨 Mode 4 — The Wrong-Mass Penalty
The question every beginner eventually asks: “what if I just search with the average mass?” Enter a formula and your search tolerance — the mode converts the gap into ppm and delivers the verdict. Glucose: 514.3 ppm against a 5 ppm window, a 102.9× miss. No database match survives that.
🏆 Mode 5 — Two Formulas, Four Masses
The isobar detector of the average vs monoisotopic mass suite. Aspirin C9H8O4 vs glucose C6H12O6: same nominal mass 180, but monoisotopic masses 21.13 mDa apart — one peak at unit resolution, two peaks on any Orbitrap. It also makes size effects visible: compare glucose with insulin and watch the average−mono gap jump from 0.09 to 3.95 Da.
The Formulas (With the Box You Should Memorize)
Every average vs monoisotopic mass problem reduces to three lines of arithmetic:
Average mass = Σ nᵢ × atomic weightᵢ (C 12.011 · H 1.008 · O 15.999)
Monoisotopic mass = Σ nᵢ × top-isotope massᵢ (¹²C 12 · ¹H 1.00782503 · ¹⁶O 15.99491462)
Gap = average − mono · per element: n × (atomic weight − top-isotope mass)
Spectra speak monoisotopic · balances speak average · never mix the currencies.
Look at the two carbon entries and the whole average vs monoisotopic mass story is there. The atomic weight 12.011 is 98.93% × 12 plus 1.07% × 13.00335 — the ¹³C fraction pulls the average up by about 0.011 Da per carbon. The monoisotopic entry ignores ¹³C entirely, which is exactly what the first peak of the isotope envelope does. Multiply that 0.011 by six carbons and you already have 0.066 Da of glucose’s 0.0926 Da gap.
The average vs monoisotopic mass gap line is the practical weapon: because it’s a simple per-element sum, you can predict it without computing either full mass. A molecule with 27 carbons (cholesterol) must sit roughly 27 × 0.011 ≈ 0.3 Da apart — and the calculator confirms 0.309 Da. That back-of-envelope trick wins exam marks and sanity-checks software output in equal measure; the same per-element mindset powers our atomic mass calculator.
Which Mass Should You Use? The Decision Table
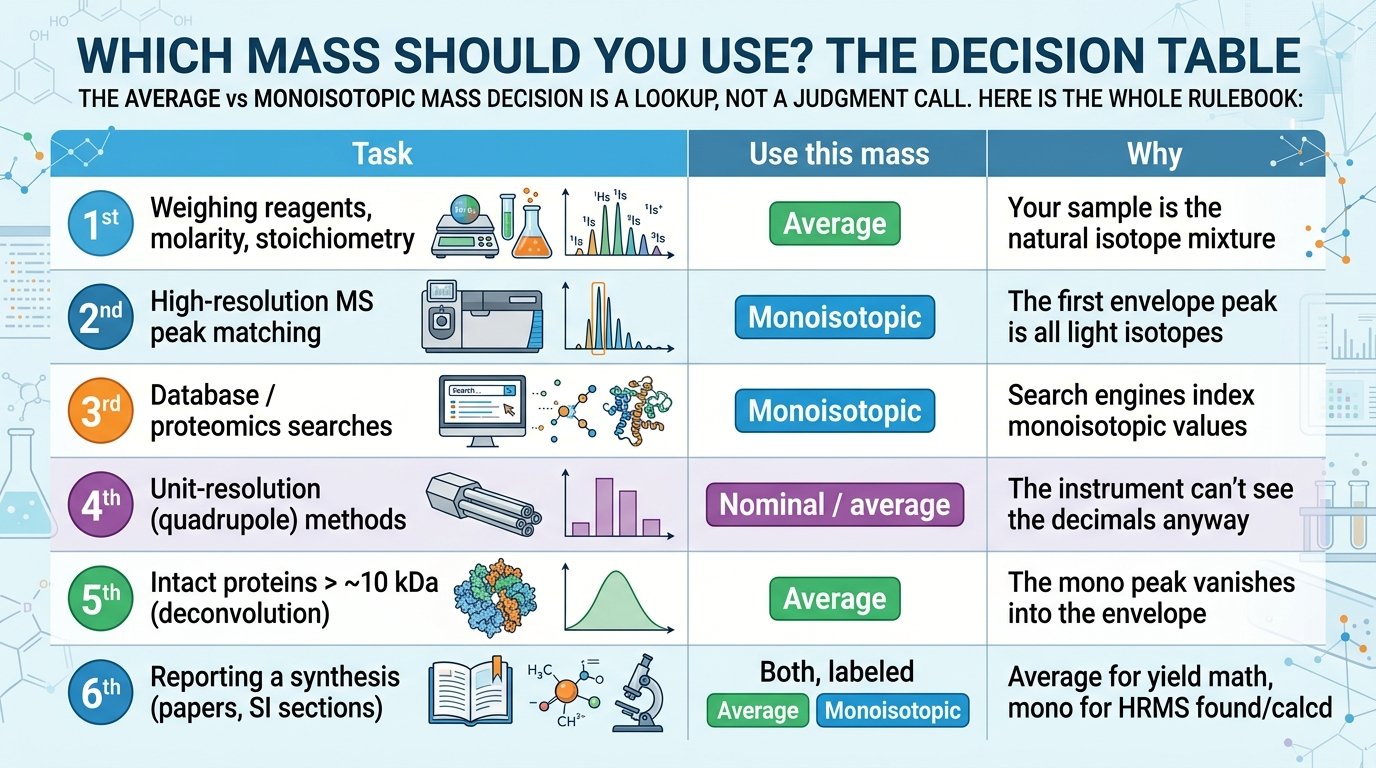
The average vs monoisotopic mass decision is a lookup, not a judgment call. Here is the whole rulebook:
| Task | Use this mass | Why |
|---|---|---|
| Weighing reagents, molarity, stoichiometry | Average | Your sample is the natural isotope mixture |
| High-resolution MS peak matching | Monoisotopic | The first envelope peak is all light isotopes |
| Database / proteomics searches | Monoisotopic | Search engines index monoisotopic values |
| Unit-resolution (quadrupole) methods | Nominal / average | The instrument can’t see the decimals anyway |
| Intact proteins > ~10 kDa (deconvolution) | Average | The mono peak vanishes into the envelope |
| Reporting a synthesis (papers, SI sections) | Both, labeled | Average for yield math, mono for HRMS found/calcd |
Two average vs monoisotopic mass rows deserve emphasis. First, the protein row: above roughly 8–10 kDa the monoisotopic peak becomes a minority species among its own isotopologues, so intact-protein work reports average masses from deconvolution — the average vs monoisotopic mass choice flips with size. Second, the reporting row: journals expect “HRMS calcd for C₈H₁₁N₄O₂⁺ 195.0877, found 195.0881” (monoisotopic) in the same paper where yields were computed with average masses from our grams to moles calculator. Both currencies, clearly labeled, never mixed.
Gap Anatomy: Why Carbon Runs the Show
Here is the insight Mode 3 was built around: the average vs monoisotopic mass gap decomposes exactly, element by element, as count × (atomic weight − top-isotope mass). Those per-atom differences are wildly unequal. Carbon’s is 0.011 Da (the ¹³C tax). Oxygen’s is 0.0041 Da (¹⁷O and ¹⁸O). Hydrogen’s is a negligible 0.00017 Da, because deuterium is only 0.0156% of natural hydrogen. Nitrogen sits at 0.0040, sulfur at a hefty 0.088 (⁴·²⁵% ³⁴S).
Run glucose through the average vs monoisotopic mass anatomy and the shares fall out: carbon 0.066 Da (71.3%), oxygen 0.0245 Da (26.5%), hydrogen 0.0021 Da (2.3%). For organic molecules the pattern is nearly universal — carbon owns two-thirds to three-quarters of every gap, which is why the rule of thumb “gap ≈ 0.011 × carbon count” works so well. Sulfur-rich molecules break the pattern: oxytocin’s two sulfurs contribute 0.176 Da, over 23% of its 0.757 Da gap from just two atoms.
This average vs monoisotopic mass anatomy has a beautiful corollary for isotope envelopes: the same ¹³C abundance that inflates the average mass also sets the height of the M+1 peak (roughly 1.1% × carbon count relative to M). The two phenomena — the average vs monoisotopic mass gap and the envelope shape — are one piece of physics seen from two angles, a connection our exact mass calculator post develops through full isotope patterns.
Three Worked Examples, Step by Step
Example 1 — The classic average vs monoisotopic mass comparison
Average. 6 × 12.011 + 12 × 1.008 + 6 × 15.999 = 72.066 + 12.096 + 95.994 = 180.156 g/mol.
Monoisotopic. 6 × 12 + 12 × 1.00782503 + 6 × 15.99491462 = 72 + 12.09390 + 95.96949 = 180.0634 Da.
Gap. 180.156 − 180.0634 = 0.0926 Da — 0.0514% of the mass, ~71% of it from carbon.
Example 2 — A peptide from two residue tables
Monoisotopic. Σ mono residues 781.34938 + H₂O 18.01056 = 799.3599 Da.
Average. Σ average residues 781.8175 + H₂O 18.0153 = 799.8328 Da.
Gap. 0.4729 Da after only seven residues — proteomics search engines would miss by ~590 ppm if fed the average value.
Example 3 — The wrong-mass penalty, quantified
Step 1. Offset = 180.156 − 180.0634 = 0.0926 Da = 92.61 mDa.
Step 2. As ppm: 0.0926 ÷ 180.0634 × 10⁶ = 514.3 ppm.
Verdict. 102.9× the 5 ppm window — the true compound is filtered out before you ever see it.
Run all three in the average vs monoisotopic mass calculator above and compare its printed steps with these — they match line for line, because the tool executes exactly this arithmetic at full precision.
Reference Table: 10 Compounds, Both Masses
These ten compounds cover most coursework and method development. All values come from the average vs monoisotopic mass calculator on this page:
| Compound | Formula | Average (g/mol) | Monoisotopic (Da) | Gap (Da) |
|---|---|---|---|---|
| Water | H₂O | 18.015 | 18.0106 | 0.0044 |
| Aspirin | C₉H₈O₄ | 180.159 | 180.0423 | 0.1165 |
| Glucose | C₆H₁₂O₆ | 180.156 | 180.0634 | 0.0926 |
| Caffeine | C₈H₁₀N₄O₂ | 194.194 | 194.0804 | 0.1136 |
| Testosterone | C₁₉H₂₈O₂ | 288.431 | 288.2089 | 0.2221 |
| Sucrose | C₁₂H₂₂O₁₁ | 342.297 | 342.1162 | 0.1808 |
| Cholesterol | C₂₇H₄₆O | 386.664 | 386.3549 | 0.3091 |
| Oxytocin | C₄₃H₆₆N₁₂O₁₂S₂ | 1007.19 | 1006.4365 | 0.757 |
| Vitamin B12 | C₆₃H₈₈CoN₁₄O₁₄P | 1355.39 | 1354.5674 | 0.821 |
| Insulin | C₂₅₄H₃₇₇N₆₅O₇₅S₆ | 5733.55 | 5729.6009 | 3.949 |
Read the average vs monoisotopic mass gap column top to bottom and the scaling law jumps out: 0.0044 Da for water, 0.3 for cholesterol, nearly 4 Da for insulin — roughly 0.07% of the mass all the way down, because carbon fraction is roughly constant in organic matter. Note aspirin vs glucose: their average masses differ by only 0.003 (indistinguishable on any balance) while their monoisotopic masses differ by 21 mDa (trivially resolved by MS). Hydrate and ionic formulas belong to their own tools: the molar mass of hydrates calculator and the formula weight calculator.
What Instruments See: Envelopes, Isobars & Resolution
The average vs monoisotopic mass split becomes physical the moment a spectrum appears. A high-resolution instrument turns the average vs monoisotopic mass idea into a picture — an isotope envelope: the monoisotopic peak first, then M+1 (one ¹³C), M+2 and so on, one dalton apart per charge. The average mass corresponds to the abundance-weighted centroid of that whole envelope — a point that usually falls between peaks, where no ion actually exists. That’s the deepest reason spectra can’t use average masses: nothing sits there.
- Orbitraps and Q-TOFs resolve the envelope for small and mid-size molecules, so monoisotopic values rule below ~8 kDa.
- Quadrupoles smear the envelope into one unit-resolution hump — they effectively measure something close to the average, which is why triple-quad methods quote nominal masses.
- Intact-protein deconvolution reports average masses, because above ~8–10 kDa the pure-¹²C species is too rare to detect reliably.
- Isobar separation is resolution arithmetic: aspirin and glucose sit 21.13 mDa apart at m/z 180, needing resolution of only ~8,500 — easy for any modern instrument, impossible at unit resolution.
The historic average vs monoisotopic mass version of that last bullet decided real physics: N₂ and CO are isobars at nominal 28, split by just 11.2 mDa — a separation that early mass spectrographs turned into proof of nuclear binding-energy differences. Mode 5’s chip reproduces it in one click.
Who Needs the Average vs Monoisotopic Distinction?
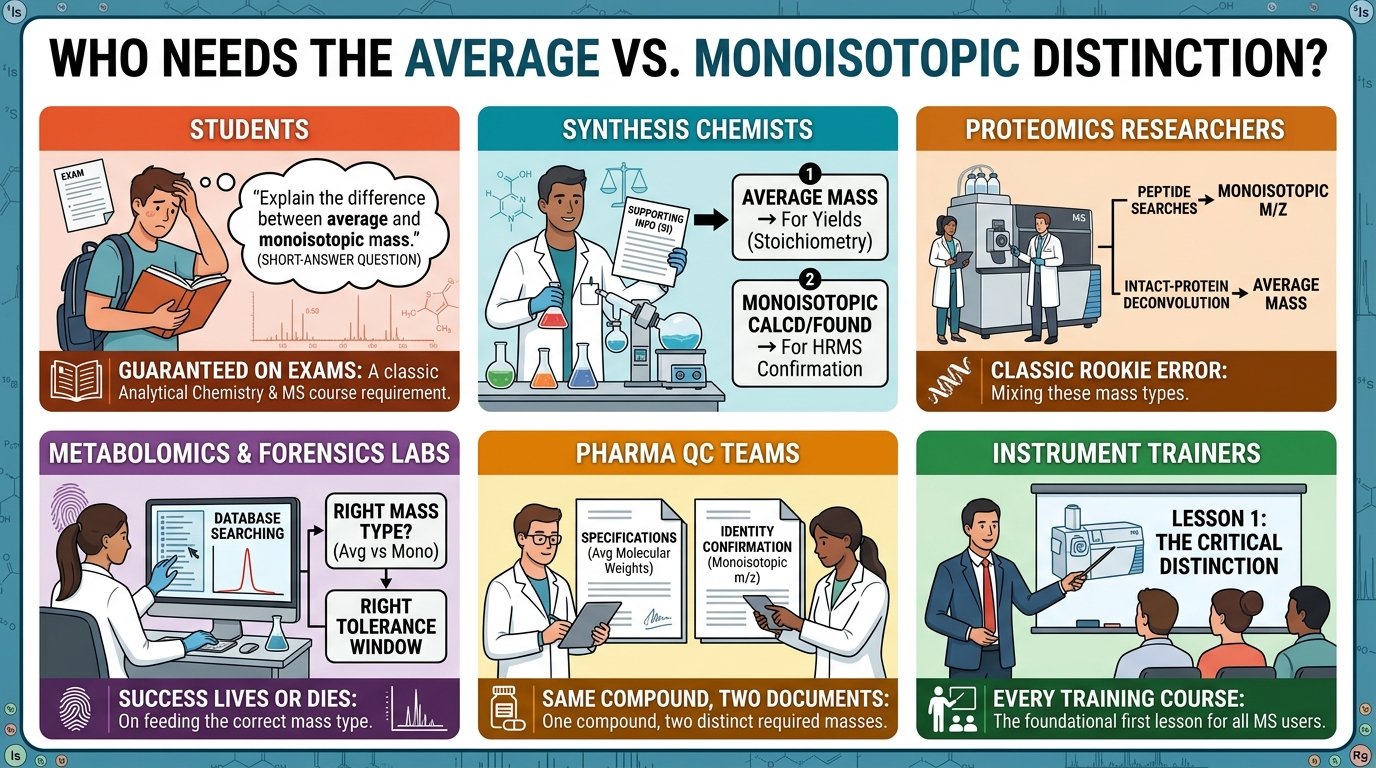
- Students — “explain the difference between average and monoisotopic mass” is a guaranteed average vs monoisotopic mass short-answer question in analytical chemistry and MS courses.
- Synthesis chemists — every paper’s SI needs both average vs monoisotopic mass values: average masses for yields, monoisotopic calcd/found pairs for HRMS confirmation.
- Proteomics researchers — peptide searches are monoisotopic; intact-protein deconvolution is average; mixing them is the field’s classic rookie error.
- Metabolomics & forensics labs — database searching lives or dies on feeding the right mass type into the right tolerance window.
- Pharma QC teams — specifications quote average molecular weights; identity confirmation quotes monoisotopic m/z — the same compound, two documents, two masses.
- Instrument trainers — the first lesson of every MS training course is exactly this distinction.
For the bench math on the average side — dilutions, yields, limiting reagents — our molarity calculator and stoichiometry calculator pick up where this page leaves off.
Full Lab Walkthrough: The Wrong-Mass Mistake, Fixed
Here’s a real support-desk classic, resolved with the calculator above exactly as it happened.
The problem: a graduate student runs caffeine on a Q-TOF, sees a clean peak at m/z 195.0879, searches the library with “molecular weight 194.19 + 1.008” — and gets zero hits. The compound is sitting right there.
- Diagnose the average vs monoisotopic mass mix-up. Mode 1: C8H10N4O2 → average 194.194 g/mol vs monoisotopic 194.0804 Da. The student searched with the average.
- Quantify. Mode 4 at 10 ppm (TOF class): the wrong mass costs 585.2 ppm — 58.5× the window. Zero hits is exactly what should happen.
- Correct. The proper target is monoisotopic [M+H]⁺ = 194.0804 + 1.00728 = 195.0877. The observed 195.0879 is 1.0 ppm away — a textbook match.
- Verify the lesson. Mode 3 shows where the 0.1136 Da confusion came from: eight carbons contributing 0.088 Da of ¹³C tax, plus nitrogen and oxygen.
- Report. The toolbar printout — both masses, the gap, the ppm arithmetic — goes into the lab notebook so the next rotation student doesn’t repeat it.
Total average vs monoisotopic mass fix time: two minutes. The average vs monoisotopic mass distinction costs nothing once you know it — and costs entire afternoons when you don’t.
A Short History: From Whole Numbers to Two Masses
Before the average vs monoisotopic mass split existed, chemistry lived happily with one mass per element for a century — Dalton’s tables, refined by Berzelius, perfected by Theodore Richards’ Nobel-winning atomic-weight measurements. The crack appeared in 1919, when Francis Aston’s mass spectrograph split neon into ²⁰Ne and ²²Ne: the chemist’s 20.18 was an average of things no single atom possessed. Every atomic weight on the wall chart was suddenly two kinds of number at once — a weighted mean for the balance, and a set of exact isotope masses for the physicist.
The two currencies were formally reconciled in 1961, when the unified atomic mass unit was fixed to one-twelfth of ¹²C, giving average and monoisotopic masses a common scale. For decades the average vs monoisotopic mass distinction stayed academic — instruments couldn’t resolve it for anything interesting. Electrospray (John Fenn, Nobel 2002) and MALDI changed that by flying peptides and proteins intact, and the Orbitrap (Alexander Makarov, 2000) made four-decimal mass accuracy routine. Today the average vs monoisotopic mass choice is embedded in every software dropdown in proteomics — a century of physics compressed into a setting that still catches beginners weekly.
The Two Masses in Everyday Life
- Pharmacy labels — the “molecular weight” on every drug monograph is the average mass; the HRMS identity data behind the approval is monoisotopic.
- Doping control — testosterone is weighed into calibration standards at 288.43 g/mol and confirmed in athletes’ samples at monoisotopic 288.2089 Da. Same molecule, both currencies, one report.
- Newborn screening — MS/MS panels match amino-acid monoisotopic masses, while the reagent kits were formulated with average masses.
- Insulin prescriptions — biosimilar QC checks the deconvoluted average mass (5733.5) because the monoisotopic peak is invisible at that size.
- Food fraud testing — honey adulteration screens match sugar monoisotopic masses; the sugar content itself is quoted in average-mass grams.
- Environmental monitoring — pesticide residues are identified by monoisotopic m/z and regulated in mg/kg computed with average masses.
Every bullet is the same average vs monoisotopic mass lesson: the two masses coexist in every real workflow, each doing its own job. Mixture-level averaging — a third, different kind of average — is covered in our average molecular weight of mixture guide.
Practice Problems (With Answers)
Work each average vs monoisotopic mass problem by hand first, then verify with the free calculator above. Answers are hidden until you click.
Problem 1 — Compute both masses of caffeine, C₈H₁₀N₄O₂, and the gap.
Average: 8×12.011 + 10×1.008 + 4×14.007 + 2×15.999 = 194.194 g/mol. Monoisotopic: 96 + 10.07825 + 56.01230 + 31.98983 = 194.0804 Da. Gap = 0.1136 Da.
Problem 2 — Estimate cholesterol’s (C₂₇H₄₆O) gap using the carbon rule, then check it.
Estimate: 27 × 0.011 ≈ 0.30 Da. Exact: 386.664 − 386.3549 = 0.3091 Da — the carbon rule lands within 3%.
Problem 3 — What ppm error results from searching glucose with its average mass on a 5-ppm instrument?
0.0926 ÷ 180.0634 × 10⁶ = 514.3 ppm — 102.9× the tolerance window. The match is impossible.
Problem 4 — YGGFL (Leu-enkephalin): both masses?
Monoisotopic: 537.25872 + 18.01056 = 555.2693 Da. Average: 537.6158 + 18.0153 = 555.6311 Da. Gap = 0.3618 Da.
Problem 5 — Are N₂ and CO isobars? By how much do their exact masses differ?
Yes — both nominal 28. N₂ = 28.0062, CO = 27.9949: a difference of 11.2 mDa, needing resolution of only ~2,500 to separate.
Tips for Fast, Error-Free Work
- ✅ Label every average vs monoisotopic mass value you write down — “180.16 (avg)” or “180.0634 (mono)”. Unlabeled masses cause the mix-ups.
- ✅ Use the carbon rule for sanity checks — gap ≈ 0.011 × carbon count. If software shows something wildly different, an input is wrong.
- ✅ Check the software dropdown — every search engine and deconvolution tool has an average/monoisotopic setting; verify it before blaming the instrument.
- ✅ Watch the size crossover — below ~8 kDa report monoisotopic, above it report average; state which one in every table caption.
- ✅ Never “convert” by adding a constant — the gap is composition-dependent (compare sulfur-rich vs carbon-rich molecules); compute it, don’t guess it.
- ✅ Reset between compounds — the ↺ Reset button on each mode keeps old inputs from contaminating the next comparison.
⚗️ Pro workflow: Mode 1 for the average vs monoisotopic mass pair → Mode 3 to see which elements built the gap → Mode 4 before any database search to know the stakes → Mode 2 for peptides → Mode 5 whenever two candidates share a nominal mass. Five tabs, two currencies, zero mix-ups.
5 Common Mistakes to Avoid
A decade of marking analytical papers produces the same five errors in average vs monoisotopic mass work on repeat:
- Searching HRMS databases with average masses. The ~500 ppm penalty guarantees zero hits — the most common “my compound isn’t there” support ticket.
- Weighing reagents with monoisotopic masses. The error is small (~0.05%) but systematic — and inexcusable when the correct average is one click away.
- Assuming the gap is a universal constant. It scales with composition: 0.0044 Da for water, 3.95 Da for insulin. There is no single “correction factor.”
- Reporting deconvoluted protein masses as monoisotopic. Above ~10 kDa deconvolution returns the average — labeling it “monoisotopic” is a reviewer’s favorite catch.
- Confusing monoisotopic with “lightest isotope.” It’s the most abundant isotope: for boron that’s ¹¹B, not ¹⁰B — the lighter isotope loses.
How This Calculator Is Different
| Feature | This calculator | Generic MW tool | By hand |
|---|---|---|---|
| Both masses side by side | ✅ With gap in Da and % | ❌ One unlabeled number | ⚠️ Two full calculations |
| Per-element gap anatomy | ✅ Ranked shares + graph | ❌ | ⚠️ Tedious |
| Wrong-mass ppm penalty | ✅ Against your tolerance | ❌ | ✅ If you know the trick |
| Peptides from two residue tables | ✅ Mono AND average | ❌ Not offered | ⚠️ Two tables to look up |
| Isobar comparison in mDa | ✅ Two formulas at once | ❌ | ⚠️ Error-prone |
| Export & history | ✅ CSV/TXT/print/share + last 10 | ❌ Usually none | ❌ Notebook |
Related average vs monoisotopic mass tools go deeper on the neighboring ideas: MS-side exact masses in the monoisotopic mass calculator, and the polymer world’s completely different mass averages in the number average molecular weight polymer, weight average molecular weight polymer and polydispersity index calculator trilogy.
Where the Numbers Come From
The average vs monoisotopic mass data splits cleanly: the average side uses IUPAC 2021 standard atomic weights — the same 118-element dataset behind every tool on this site. The monoisotopic side uses AME/CODATA exact isotope masses (¹²C exactly 12 by definition of the unified atomic mass unit) with IUPAC/CIAAW abundances for 63 stable elements, and the 20 amino-acid residue tables (both mono and average) follow the standard proteomics values used by mainstream search engines.
Small differences against older textbooks (a few units in the last decimal) reflect successive IUPAC and AME refinements, not errors. If you ever spot a discrepancy worth checking, our corrections policy explains how we verify and fix reports — usually within days.
Exam Checklist
☐ I know the paired constants: C 12.011 vs 12 exactly; H 1.008 vs 1.00782503; O 15.999 vs 15.99491462.
☐ I can state the rule: spectra speak monoisotopic, balances speak average.
☐ I can estimate the gap with the carbon rule (≈ 0.011 × C count) and compute it exactly.
☐ I can explain why the average mass falls between envelope peaks where no ion exists.
☐ I can convert a gap into a ppm penalty and judge it against a search tolerance.
☐ I know the ~8 kDa crossover where protein work switches to average masses.
☐ I’ve verified my practice answers with the average vs monoisotopic mass calculator above.
Frequently Asked Questions
What is the difference between average and monoisotopic mass?
The average mass weights every isotope by natural abundance (C = 12.011) and is what a balance weighs; the monoisotopic mass uses only the most abundant isotope at its exact mass (¹²C = 12) and is where the first high-resolution MS peak appears. Glucose: 180.156 vs 180.0634 — a 0.0926 Da gap.
When should I use the average mass and when the monoisotopic mass?
Average for weighing, molarity, stoichiometry and intact proteins above ~8–10 kDa; monoisotopic for high-resolution MS peaks, database searches and HRMS reporting. Never mix them in one calculation.
Why is the monoisotopic mass always smaller than the average mass?
For typical organic molecules the most abundant isotopes (¹²C, ¹H, ¹⁶O, ¹⁴N) are also the lightest, so excluding the heavy isotopes lowers the sum. The average includes ¹³C, ²H and ¹⁸O, which pull the weighted mean up.
How big is the gap between the two masses?
Roughly 0.05–0.07% of the mass for organic molecules — about 0.011 Da per carbon atom. Water: 0.0044 Da; glucose: 0.0926 Da; insulin: 3.95 Da. It grows with size because there are more chances to contain a heavy isotope.
Is this average vs monoisotopic mass calculator free?
Yes, completely free — no registration, no daily limits. It runs entirely in your browser, and your history stays on your own device.
What happens if I search a database with the average mass?
On a high-resolution instrument, a guaranteed miss: for glucose the average mass is 514 ppm away from the true monoisotopic peak — about 100× a typical 5 ppm tolerance. Mode 4 of the calculator quantifies this for any formula.
Which mass do proteomics tools use?
Peptide-level searches (bottom-up proteomics) use monoisotopic masses. Intact-protein deconvolution (top-down, biopharma QC) reports average masses, because above ~8–10 kDa the monoisotopic peak is too weak to detect.
Why does the average mass fall between MS peaks?
The spectrum shows discrete isotopologue peaks one dalton apart; the average is the abundance-weighted centroid of that envelope, which almost never coincides with an actual peak. No ion has the average mass — it’s a statistical property of the mixture.
What are isobars and which mass separates them?
Isobars share a nominal mass but differ in exact mass: aspirin and glucose both sit at nominal 180 yet are 21.13 mDa apart monoisotopically. Only exact (monoisotopic) masses — and enough resolution — can tell them apart.
Which data does the calculator use?
IUPAC 2021 standard atomic weights for the average side; AME/CODATA exact isotope masses with IUPAC/CIAAW abundances (63 stable elements) for the monoisotopic side; standard proteomics residue tables for peptides.
10 Facts Worth Knowing
- The average vs monoisotopic mass paradox: no single atom of carbon weighs 12.011 — the average mass describes the mixture, not any molecule in it.
- The average mass of a compound is a point on the spectrum where, almost always, no peak exists.
- Carbon supplies ~70% of the average–mono gap in most organic molecules, purely through its 1.07% of ¹³C.
- Hydrogen barely contributes to the gap — deuterium is just 0.0156% of natural hydrogen — even in hydrogen-rich lipids.
- Sulfur punches far above its weight: one sulfur atom adds as much gap as ~8 carbons (0.088 Da), thanks to 4.25% ³⁴S.
- N₂ vs CO — 11.2 mDa apart at nominal 28 — was the isobar pair that helped early mass spectroscopists prove nuclear binding-energy differences.
- Above roughly 8,000 Da the monoisotopic peak stops being the tallest of the envelope, and beyond ~10 kDa it effectively disappears — the practical reason protein masses go average.
- Insulin’s two masses differ by almost 4 Da — larger than the mass of a helium-4 nucleus.
- Leucine and isoleucine share both masses exactly (same formula) — no mass measurement of any kind can distinguish them; only fragmentation can.
- The 1961 carbon-12 convention that unified the two mass scales replaced two competing oxygen standards — chemists and physicists had been using slightly different “atomic weights” for 30 years.
🔗 Trusted external resources
Final Thoughts
The average vs monoisotopic mass distinction looks like pedantry until the first time it costs you an afternoon — a zero-hit database search, a mislabeled protein mass, a reviewer’s comment on an SI table. Behind every average vs monoisotopic mass decision sit four small rules: the average describes the mixture, the monoisotopic describes the first peak, the gap is a computable per-element sum dominated by carbon, and every mass you write down deserves a label. Master those, let the calculator above verify every line, and this corner of chemistry becomes one of the most systematic places to score — in the exam hall and at the bench.
Bookmark this average vs monoisotopic mass page for your next spectroscopy problem set or LC-MS run, share it with a labmate before their first database search, and explore the rest of our free chemistry tools — from the molecular weight calculator homepage to the monoisotopic mass calculator for the MS side of the story. Questions or corrections? Reach us any time through the contact page — and you can read more about the site’s mission on our about page.
Written & Reviewed By
Ahmad Raza, M.Phil. Chemistry
Ahmad is a chemistry educator and science content developer with over 10 years of experience teaching analytical and physical chemistry. He builds free calculation tools that help students and lab professionals work faster and make fewer errors. When he’s not balancing equations, he’s usually grading titration reports.